Friday, January 17, 2014

Dynamic coloring using Cycles/OSL

Description

 We want to make it possible to assign colors to objects based on their position in space.
Imagine we measured or calculated a 3D temperature distribution within a certain space. In order to assess the temperature at the surface of objects within that space, it would be nice to map the temperature information into those objects as local colors.

As an example we created a small movie. we know the temperature distribution within the wire frame box. Now we move a plane and a ball through this space and have its colors reflect the local value of the temperature. Of course, this can be used for any data field!


Download

The blender file together with the needed data files and osl scripts can be obtained on one zip file (including a blender addon parseheader which can display the wire frame box based on the used header file)

Former method

The previously described method of assigning colors to vertices can be used in combination with cycles as well (the "use vertex color" option must be used). This offers the possibility to assign the colors in a single shot, which remain constant over time. So in order to get dynamic coloring behaviour, we need to apply the color sampling step over and over again, using a python script.

New improved Cycles method

Within the cycles renderer, we can make use of OSL scripts, which allow the reading of image files to get external data in. These srcipts are called every time a picture is rendered, so the dynamics is taken care of by the renderer itself.

The normal use of this image reading feature is to import an image which can be used as a texture. Native OSL supports the field3d file format, enabling reading of 3D data sets. However, the osl implementation used in blender does not support this file format, so we are left with reading 2D images.
A set of 2D images can also be thought of a 3D data block, so this is the approach we took:
  1. Based on a 3D data field we produced a set of black-and-white images in png format.
  2. Next to these images a header file is created which described some characteristics of the data field
    • How many voxels in all three directions
    • What is the position of the data field in space
    • What is the size of the data field
    • The location of the image files
  3. The OSL script reads the header file upon compilation and uses as input
    • The current point 
    • The default value to use when the current point is located outside the data field
  4. The OSL script maps the coordinate of the current point to a data value, reading the appropriate data (image) files and reports a value between zero and one
  5. The output can be used as input for a colormap
Monday, June 24, 2013

Default value field

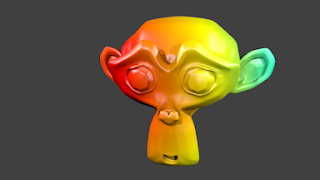
Within the addon a function is defined which can produce a standard value field. This field is used in the example animations to color Suzanne.

Code

The code of this function is quite straightforward:


def fillLat():
    maxValue = 3.5
    lat = Lattice((30,30,30),(-1.0,-1.0,-1.0),(3.0,3.0,3.0))
    for z in range(lat.dim[2]) :
        for y in range(lat.dim[1]) :
            for x in range(lat.dim[0]) :
                wp = lat.discreteToWorld((x,y,z))
                d = math.sqrt(wp[0]*wp[0] + wp[1]*wp[1] + wp[2]*wp[2])
                lat.setValue(maxValue - d,(x,y,z))
    lat.min = 0.0
    lat.max = maxValue
    return lat

 Here a couple of things happen
  1. maxValue is defined to be 3.5
  2. We create a Lattice defined by three tuples
    1. Number of voxels in each direction
    2. Position of first corner of the total data field in the world coordinates (global coordinate system)
    3. Extent of the total data field
  3. Loop over all dimensions, to handle every voxel
    1. Get the position of the (center of the) current voxel in the world coordinates (wp)
    2. Calculate the distance (d) of the current voxel relative to (0,0,0)
    3. Set the value of the current voxel to the defined maximum minus the distance
  4. Set the minimum value to 0.0; this value can be used to initialize the colormap
  5. Set the maximum value to maxValue; this value can be used to initialize the colormap
  6. Return the create lattice
This code can be found in 
radth-packages/radthlib/lattice.py
When another default value field is requested, this function must be re-implemented, or such a lattice can be read from a pickle file.

Friday, June 21, 2013

New version 0.8

New version

Now there is an updated version of the colormesh (0.8) blender addon available
This version contains code in which the two issues I raised in my original post are solved.

Solutions

  1. The question on storing data during a blender session is described in my previous post
  2. The use of an auxiliary python lib was solved by creating a directory radth-packages in which the extra lib was placed. Within the initialisation of the addon, we add this radth-packages dir to the python load path.

Friday, June 14, 2013

How to store data during a blender session

After some more discussion we now arrived at the following solution to my original problem: use a new class and put you data in a static variable.
For the coloring of meshes during an animation, this solution (in its simplest form) looks like this:

import bpy
from radthcolormesh.colormesh import ColorMesh
class CMStorage :
    colorMesh = ColorMesh()
   
def applyColor(scene) :
    CMStorage.colorMesh.colorMesh('Suzanne')
bpy.app.handlers.frame_change_pre.append(applyColor)
Which looks nice and simple and can be easily expanded.

Tuesday, June 11, 2013

Storing data during a blender session

On the blenderartists forum, CoDEmanX solved my first problem, by stating that you could misuse (static) class variables for this.
Now, creating a movie loop in which coloring must be applied, can be accomplished using something like

import bpy
from radthcolormesh.colormesh import ColorMesh
bpy.conext.scene.__class__.colorMesh = ColorMesh()
def applyColor(scene) :
    colMaxLimit = 150
    latScaleLimit = 650
    latHide = 350
    latUnhide = 550
    frameNumber = scene.frame_current
    if frameNumber < colMaxLimit:
        maxValue = 0.1*(colMaxLimit - frameNumber) + 3.5
        colorMesh.colormap.max = maxValue
    if latHide <= frameNumber <= latUnhide:
        bpy.data.objects["Lat"].hide_render = True
    else:
        bpy.data.objects["Lat"].hide_render = False
    if frameNumber > latScaleLimit:
        scene.colorMesh.lat.setScale(-0.95*float(frameNumber - latScaleLimit)/199.0 + 199.95/199.0)
    scene.colorMesh.colorMesh('Suzanne')
bpy.app.handlers.frame_change_pre.append(applyColor)
Now the data is created only once.

Friday, June 7, 2013

Color mesh

Introduction

Within scientific visualization we often want to show the local value of a certain parameter field as a (vertex)color. Think of a temperature distribution in 3D and a mesh which is colored so that we can assess the temperatures at the mesh locations.

Blender addon

In order to accomplish this task, we have created an addon for blender which is capable of coloring a mesh. This is done by generating or reading a 3D data field which can be sampled for a value anywhere in 3D space. The obtained value can be converted into an RGB color through our own colormap. 
So the whole process looks like this
  • For all vertices
    • Find the location
    • Get the parameter value at that location
    • Convert the value into a color
    • Assign the color to the vertex
The addon can be found here: colormesh.zip

Examples

We have used the buildin value field to put some color on Suzanne.

Simple image

To start off with: plain and simple

Animation

We have created an animation coloredSuzanne.avi in which we show some possibilities this plugin offers.

The movie is divided in different phases:
  1. We start off with suzanne shown in a box in which the original parameter field is defined. The maximum of the colormap is set very high to force all values to map to the lowest color bin
  2. After zooming in, we lower the maximum value of the color map until it reaches 3.5: the maximum value found in our data set. Suzanne is now shown as the image above
  3. Suzanne is rotated so a single vertex  changes position yielding different values and thus different colors
  4. A second rotation is made, but now the camera also rotates along, showing the change of color more clearly
  5. Suzanne is shifted through the parameter space and again colored accordingly
  6. When parts fall outside the data field, a value of 0 is assigned which results in a blue color
  7. When zooming in, the area obtaining the blue color keeps on getting bigger. Here we scale the space of the parameter field from 1 to 0.1, forcing an ever bigger part of Suzanne to be located outside the data field and hence be colored blue

Blender file

People who want to play with this example can do so using the blend file coloredSuzanna.blend we used for the animation. 
(Do not forget to install the addon ;-)

Questions

While developing this addon, two questions arose to which we don't have a clear answer
  1. Would it be possible to store data during a blender session? This addon needs to have a parameter field. It would be nice if we could store this for the course of the program; now we generate/read the data over and over again for every frame in which meshes need to be re-colored.
  2. This addon uses a python module with no blender dependence  This makes it possible to use these classes outside a blender context enabling the creation of data field files. What is the correct location for such a general python module? Now we just put it in the addons directory to ensure it is in the python path.

Introduction

On this blog we want to explore the possibilities of using blender for scientific visualization.